Synoptic weather charts
The word ’synoptic‘ simply means a summary of the current situation. In weather terms, this means the pressure pattern, fronts, wind direction and speed and how they will change and evolve over the coming few days.
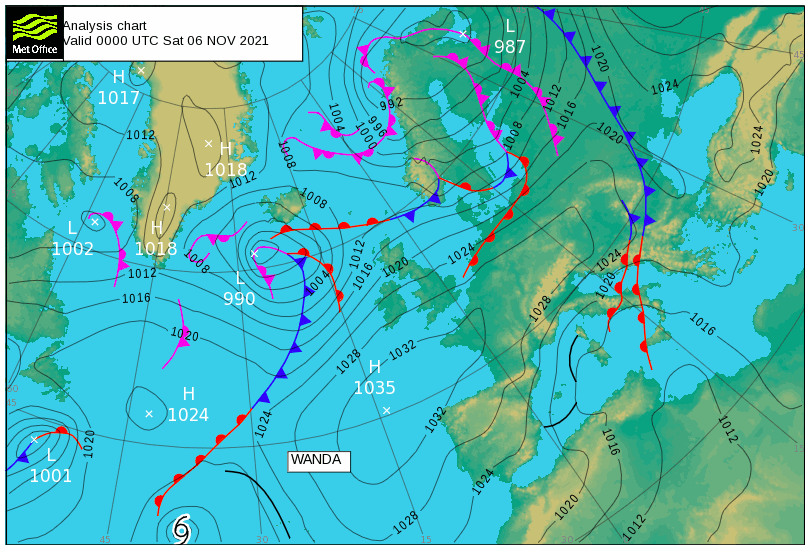
The circular lines you see on the chart are isobars, which join areas of the same barometric pressure. The pressure pattern is important because we can use it to tell us where the wind is coming from and how strong it is. It also shows areas of high and low pressure.
Air moves from high to low pressure along a gradient. If the difference between areas of high and low pressure is greater then we have a large gradient and the air will move faster to try and balance out this difference. This is shown on a synoptic chart with isobars that are very close together and we feel strong winds as a result.
In terms of the wind direction, air moves around high pressure in a clockwise direction and low pressure in an anticlockwise direction, so isobars also tell us the direction and speed of the wind.
Also on a synoptic chart are the lines, triangles and semi-circles representing ‚fronts‘.
A warm front is shown with a red line and red semi-circles and a cold front with a blue line and blue triangles. The way in which the semi-circles or triangles point shows the direction in which the front is moving. The position of a front depends on a number of meteorological factors, such as changes in wind direction or temperature, which we get from our network of weather observation sites. A few things to remember are that warm air follows a warm front and cold air follows a cold front. We also tend to see increased amounts of cloud and rainfall along the front itself. Sometimes the red or blue line of a front will be broken by crosses. This indicates that the front is weakening and the difference in the warmth or dryness of the air is becoming less marked. Cold fronts tend to move faster than warm fronts and over time they can catch up with each other and create an ‚occluded‘ front. This is shown as a purple line with a purple semi-circle and triangle next to each other. The air trapped between a warm and cold front is called a ‚warm sector‘ and we often see low cloud and patchy light rain associated with this type of air. Black lines that have no semi-circles or triangles are called ‚troughs‚ and mark areas where the air is particularly unstable. This means that the air is quite turbulent or moving around a lot, especially when we have, for example, warm air beneath cold air that wants to rise. We tend to see showers associated with this type of air, therefore they don’t mark any sort of boundary in the same way that a front does.
![]()